


Metering Overview is designed to be a fast and easy view of your metered applications.
Data Grid
The data grid is a powerful spreadsheet like control that can display your inventory data in various ways.
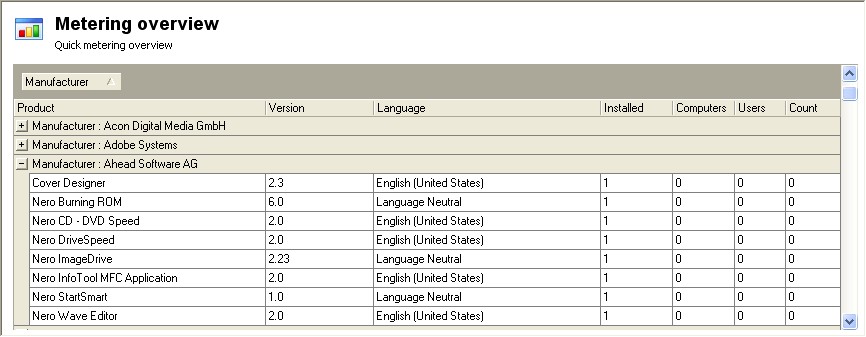
The grid columns are as follows:
| · | Manufacturer - Name of the software application vendor. |
| · | Product - Name of the software application |
| · | Version - The short version number (major and minor version numbers) of the software application. |
| · | Language - The language of the software application. |
| · | Installed - The number of computers where this application has been installed. |
| · | Computers - On how many unique computers this application has been used. |
| · | Users - The number of unique users that have used this application. |
| · | Count - How many times the software application have been used (i.e. started). |
Toolbar
You find the most common tasks in Inventory Overview in the toolbar:

| · | Details: Displays more detailed information about the selected software application. |
| · | Refresh: Refreshes the data grid with information from the inventory repository (executes the query one more time). |
| · | Print: Sends the information in the data grid to your printer. |
| · | Preview: Opens a window where you can preview the information in the data grid before it sent to the printer. |
| · | Export: Shows you the File Export dialog box where you can save the contents of the data grid in several file formats, including HTML, XML, Text, and Microsoft Excel. |
| · | Help: Displays this help information. |
See also: