|
|
< Day Day Up > |
|
In the last chapter we began a discussion about monitoring and troubleshooting SMS using status messages and log files. In this chapter we’ll round out that discussion by looking at some additional tools that can be used to assist SMS administrators as they monitor the performance of their systems and networks. We’ll start by briefly reviewing the Windows System Monitor snap-in in the Performance console and defining the SMS performance objects that are added during SMS setup. We’ll explore how to use Network Trace to determine the status of our site systems. Finally, we’ll review how to use the Network Monitor utility to monitor network performance.
In my experience, the Windows System Monitor tends to be an underappreciated utility. This is generally because administrators really haven’t taken the time to learn how to use it effectively. With a product such as Microsoft SMS 2003, which requires a significant amount of resources to function efficiently, the System Monitor can be one of the most effective tools at your disposal to identify server resource usage and load. I’d like to approach this discussion, therefore, with two objectives. The first thing I want to do is reintroduce you to the System Monitor tool and ensure that you understand how to navigate it. My second objective is to identify some System Monitor objects and counters that can be of specific use when monitoring resource usage and load on your site systems.
Perhaps one of the more important tasks involved in troubleshooting problems on your server, whether it’s any Microsoft Windows server or an SMS Site System, is to spot potential problem sources and develop and analyze trends before the problems materialize. Two basic steps are involved in achieving this kind of analysis—baseline creation and real-time tracking. Always create a baseline chart or log of so-called “normal” activity on your server. In our case, this should include the objects and counters specific to SMS 2003 server activity. When you’re analyzing performance, you can create real-time charts using the same objects and counters as you used for your baseline chart and then compare it to the baseline to determine how server performance has been affected.
Here are some basic suggestions on how to create and use System Monitor charts. As I refer to a System Monitor object and one of its counters, I will use the following syntax: Object:Counter. For example, the Processor object has several counters that you can chart, one of which is the % Processor Time. I would refer to this object and counter set as Processor:% Processor Time.
Over 20 different System Monitor objects come with Windows by default. These facilitate the monitoring of basic system resources such as memory, processor, disk, and network. In fact, these are the four areas that you’ll want to monitor on any given Windows server, especially your SMS servers. In addition to these, other objects with their corresponding counters are added when other applications are installed—for example, SMS 2003 or Microsoft SQL Server 2000. These represent additional items to monitor that can give you more information about what might be causing a specific resource situation.
| Tip |
Monitoring objects alone with no other object data against which to reference is an exercise in futility for the administrator because you can’t obtain any useful or specific information. For example, if the Processor: % Processor Time value is consistently higher than 80 percent, you might conclude that the processor might be overutilized. However, you have no information as to what might be overutilizing the processor. Add the Process: % Processor Time object for suspected processes, and you now have connected data upon which to begin your analysis. |
Baselines are also important in determining when a given system is being “resource-challenged.” It should seem obvious, but bears repeating, that unless you know what “normal” resource utilization is like on any given system, you can’t begin to analyze problems or bottlenecks, develop trends, or implement load balancing across systems. Let's begin our review by creating a chart.
To create a system monitor chart, complete the following steps:
Start the Performance console from the Administrative Tools group and then select the System Monitor node.
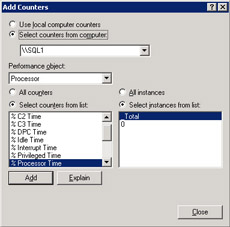
Click the Add button (the “plus” sign) from the chart window tool bar to display the Add Counters dialog box shown in Figure 6.1.
Confirm the system you’re monitoring in the Select Counters From Computer drop-down list box or choose Use Local Computer Counters if you’re monitoring the local computer.
| Tip |
Since running the System Monitor on a Windows server requires additional resources in and of itself, it’s recommended that you remotely monitor your systems from your workstation rather than at the actual system in question. |
Select the Object, Counter, and an appropriate Instance if necessary, and then click Add. If you’re unsure of a counter’s purpose or function, select it and click Explain to display a brief description at the bottom of the dialog box.
Repeat step 4 for each object:counter combination you wish to track. Then click Close.
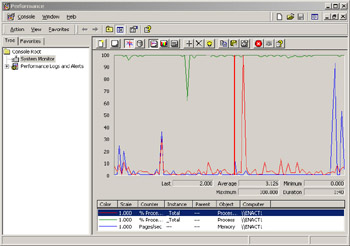
Specify the desired color, scale, width, and style for your chart lines by selecting an object:counter in the legend at the bottom of the graph, right-clicking it and selecting Properties to display the System Monitor Properties dialog box, as shown in Figure 6.2.
Figure 6.3 shows a representative chart. Three objects are being monitored—Processor: % Processor Time, Process: % Processor Time for the SMS Executive instance (smsexec), and Memory: Pages/sec. After I created the chart, I switched back to my SMS Administrator Console and updated the Collection memberships. You can see on the chart at what point I did so by the peaks recorded for each object.
| Tip |
As more objects are monitored in a chart, the busier the chart becomes. You can facilitate the reading of chart lines by turning on a highlight feature. With the chart open, press Ctrl+H. Now when you select a line on the chart, it will display with a heavy white highlight making it easier to read. Press Ctrl+H again to turn off the highlight feature. |
SMS 2003 performance, like most Windows systems, tends to revolve around a specific set of system resources that you can monitor and analyze with the help of System Monitor. These resources include processor usage, disk I/O, physical memory, and network. Table 6.1 outlines the more useful objects and counters to use when tracking and analyzing SMS Site System server performance using System Monitor.
|
Object:Counter |
Description |
Instance |
Threshold Suggestions |
|---|---|---|---|
|
Memory:Committed Bytes |
This represents the amount of virtual memory that has been committed for use for paging RAM. |
N/A |
This value should be less than the amount of physical RAM. The higher the value, the more likely that the system is experiencing a high level of paging and thrashing. |
|
Memory:Page Reads/ sec |
This represents the frequency that data had to be read from the page file back into RAM to resolve page faults. |
N/A |
A value less than 5 generally represents acceptable performance. Values over 5 might indicate a need for more RAM. |
|
Network Interface: Packets Received/ second |
This represents the total number of network packets received on this network interface. |
Each network card |
This value should remain relatively consistent and reflect average network traffic being generated. Prolonged increases in this number might indicate that a process or server on the network segment is generating additional traffic and using potentially more bandwidth. |
|
Network Interface: Bytes Received/ second |
This represents the number of bytes received per second on this network interface. |
Each network card |
This value should remain relatively consistent and reflect average network traffic being generated. Prolonged increases in this value may indicate that a process or server on the network segment is generating additional traffic and using potentially more bandwidth. |
|
Physical Disk:% Disk Time |
This represents the amount of time the disk is engaged in servicing read/write requests. |
Each physical disk |
Levels less than or equal to 80 percent generally represent acceptable system performance. |
|
Physical Disk:Current Disk Queue Length |
This represents the number of read/ write requests currently waiting to be processed on the physical disk. |
Each physical disk |
Subtract from this value the number of spindles on the disks. For example, a RAID device would have two or more spindles. The resulting value should be less than 2. |
|
Process:% Processor Time |
This represents the percentage of time spent by the processor(s) executing threads for the process selected. |
_Total, or for each process currently running. |
Use with Processor:% Processor Time to determine which SMS process in particular is utilizing processor time, and to what extent. |
|
Processor:% Processor Time |
This represents the percentage of time spent by the processor or processors execut- ing nonidle threads. |
_Total, or each installed processor |
Levels less than or equal to 80 percent generally represent acceptable system performance. |
|
SQL Server:Cache Manager:Cache Hit Ratio |
This represents how often SQL Server requests could be resolved from the SQL Server cache rather than having to query the database directly. |
N/A |
This value should be high— 98 percent or greater, which indicates efficient and responsive processing of SQL queries. |
|
System:Processor Queue Length |
This represents the number of threads waiting to be processed. |
N/A |
There should generally be no more than two requests waiting to be processed. Use this object while also monitoring the SMS Executive Thread States. |
|
Thread:Context Switches/sec |
This represents the number of context switched between threads, such as one thread requesting information from another or yielding to a higher priority thread. |
_Total/_Total |
The lower the value, the better. |
These and other System Monitor objects and counters are meant to be used together to determine overall system performance as well as to track down problem processes and potential resource bottlenecks.
As I’ve said earlier, you can’t perform effective problem or trend analysis of a system if you don’t have statistics relating to so-called “normal” performance of that system. To get this data, you should create and save chart information during periods of “normal” and peak performance. This gives you the baseline data you need to begin with. You can create these baselines by saving them as System Monitor logs.
To create a System Monitor log, complete the following steps:
Start the Performance console from the Administrative Tools group.
Expand Performance Logs And Alerts in the console tree and select Counter Logs.
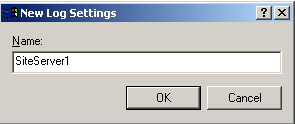
Right-click Counter Logs and choose New Log Settings to display the New Log Settings dialog box shown in Figure 6.4.
Enter a name for your log file and then click OK to display the log Properties dialog box shown in Figure 6.5.
Use the Add button to add objects and counters to the log just as you did in the section entitled “Creating a System Monitor Chart” earlier in this chapter.
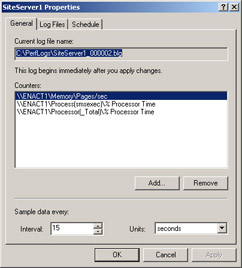
Figure
6.5: The log Properties dialog box for the SiteServer1
log.
In the Log Files tab shown in Figure 6.6, select a location to store the log file, a file name, file type, and size limit.
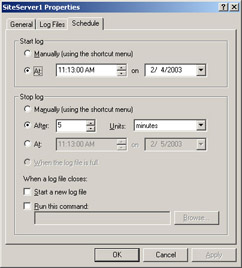
Use the settings in the Schedule tab, shown in Figure 6.7, to determine when System Monitor should begin to write information to the log, when it should stop, and whether another log file or command option should run.
Click OK to schedule the log.
After the log has run, you can view the associated data in the performance window by selecting System Monitor in the console tree and clicking the View Log File Data button (the disk drive icon). Navigate to the location of the log file you created, select it, and choose Open to display the collected data in a static chart, as shown in Figure 6.8.
When SMS 2003 is installed, Setup adds a set of SMS-specific objects and counters to the System Monitor. You can use these to assess performance levels of your SMS site system. Table 6.2 outlines these objects and some of their more useful counters for you.
|
Object |
Counter |
Description |
|---|---|---|
|
SMS Discovery Data Manager |
Total DDRs Processed |
The total number of Discovery Data Records (DDRs) processed by the Discovery Data Manager during the current session. This number should generally be high. |
|
SMS Executive Thread States |
Running Thread Count |
When using the _Total instance, this indicates the total number of SMS threads currently running. By scrolling through the instances, you can assess thread count on a thread-by-thread basis. You can also monitor sleeping threads—blocked by Yield()— and yielding threads—ready to run but not allowed due to a need to limit running threads. |
|
SMS In-Memory Queues |
Total Objects Dequeued |
This represents the total number of objects added to the queue by a specific component since the component last started. You can monitor numbers for each component by selecting it in the instance list. |
|
SMS Inventory Data Loader |
Total MIFs Processed |
This represents the total number of inventory records processed by the Inventory Data Loader during the current session. You can also monitor the number of Management Information Format (MIF) files processed per minute and the number of bad MIF files processed. |
|
SMS Software Inventory Processor |
Total SINVs Processed |
This represents the total number of software inventory records processed by the Software Inventory Processor during the current session. You can also monitor the number of software inventory records processed per minute and the number of bad records processed. |
|
SMS Standard Sender |
Sending Thread Count Average Bytes/sec |
This represents the number of threads currently sending to a destination. You can monitor the total number or monitor on a site-by-site basis by selecting the appropriate instance. This represents the average throughput of the sender. This number, generally, should be high. You can also monitor total bytes attempted, failed, and sent to establish baselines for the sender. |
|
SMS Status Messages |
Processed/sec |
This represents the number of status messages that the Status Message Manager has processed per second. Depending on the instance selected, you can monitor the total number of status messages processed or break it down between those processed from the In Memory Queue and from the Status Manager’s Inbox. |
Some of these objects are informational, providing additional data for you to help you understand how a component is working. They can all by and large assist you in establishing how resources are being utilized on your SMS servers. Remember, the idea here is to use these SMS specific objects and counters along with the traditional objects and counters used to monitor processor, memory, disk, and network performance to establish a baseline of normal activity on your SMS servers and then use that baseline to help you determine when performance is outside the norm and when it becomes unacceptable.
| Note |
Disk performance object counters are not enabled by default on Windows systems. This is to reduce the number of resources monitored and the overhead needed to monitor them. If you create a chart using disk objects such as Logical Disk and Physical Disk, no data will be created until you enable disk counters. To do this, enter the following command at a Windows command prompt: diskperf -y. You’ll need to restart the system in question before the disk counters are enabled. Enter diskperf -n to disable the disk counters when you’re finished, again remembering to restart your system for the change to take effect. |
| More Info |
System Monitor contains additional features and options. For a more complete discussion of System Monitor, refer to the online Help files included with Windows. Also, see Chapter 9, “Capacity Planning for SMS,” in the Microsoft Systems Management Server 2003 Concepts, Planning, and Installation Guide included as part of the SMS 2003 documentation, for a complete list of SMS objects and counters and for a thorough discussion of performance-related issues to consider when planning your SMS site. |
|
|
< Day Day Up > |
|