A report view is an aggregated representation of the data in the
database. It is the building block for a report. Use report views
to create reports for Web console users. You can associate each
view with a user, group, or role and give that user, group, or role
read-only or read-write access to the view. Doing this allows you
to limit the data users can see to the data they are responsible
for. You may want to create views that are based on geography or
department, for example.
When you create a new view, you're prompted to select an item to
base the view on. Items include:
Asset Global
Assets
Forms
Supporting resources
Workflows
Only attributes from the item you select are available for you
to use as filters. Some attributes are relationships to other items
in the database. For the relationship attributes, expand the
related item to see the attributes associated with the item. Once
the attribute list displays for the item, you need to create the
filters you want. Filters limit the view to the attributes you
want.
Creating a view requires five main steps:
In the navigation pane's Report tab, create a
new view instance.
On the Filter tab, specify that item's
attributes that you want to filter for.
On the Columns tab, specify the columns that
you want users to be able to see.
On the Preview tab, make sure your view looks
the way you want it.
Click the view's Properties toolbar button
to display the
Properties dialog and configure the view's security
settings.
Step 1: To create a new view instance
In the navigation pane, click the Report
tab.
Create a folder for the new view or use an existing
folder.
Right-click the folder you want to contain the view
and click New view.
Give the new view a name and double-click it.
In the dialog that appears, select the item to base
the view on and click Insert. The attributes for that item
appear in the filter list.
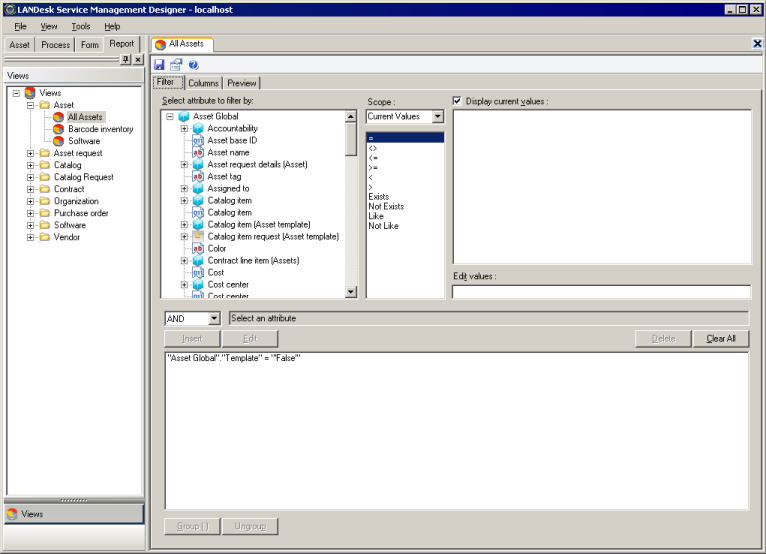
Step 2: To specify the attributes you want to filter for
Make sure the view you want to edit is open.
On the Filters tab, select an attribute to
filter by. You cannot filter on values from a multi-contact control
or table control (no results will be returned).
Select a Scope and relational operator.
Select a value from the current values list. You can
also edit a value.
Click Insert to add the statement to the query
list.
If you want to query for more than one component,
click a logical operator (AND, OR) and repeat steps
2-5.
(Optional) To group query statements so they're
evaluated as a group, select two or more query statements
and click Group(). For more information on building queries,
see Creating report view filter
queries.
Step 3: To specify the data columns users can see
Make sure the view you want to edit is open.
On the Columns tab, select the data column you
want users to see, and click the Add button.
Repeat step 2 for each data column you want to
add.
Reorder the columns with the move up and move down
buttons.
Step 4: To preview the report view
Make sure the view you want to edit is open.
On the Preview tab, make sure the report view
looks the way you want it to. Use the Filter and
Columns tabs to make changes if necessary.
Step 5: To configure view security settings
Make sure the view you want to edit is open.
On the toolbar, click the Properties button
.
On the Security tab, click Add to add
users, groups, and roles that you want to have access to this view
in the Web console.
Select each user or group that you added and check or
clear the Read or Modify permissions as
necessary.
 to display the
Properties dialog and configure the view's security
settings.
to display the
Properties dialog and configure the view's security
settings.