 Important: Important: |
|---|
| This is retired content. This content is outdated and is no longer being maintained. It is provided as a courtesy for individuals who are still using these technologies. This content may contain URLs that were valid when originally published, but now link to sites or pages that no longer exist. |
Entrek Software, Inc.
Updated August 2001
Contents
Introduction
Requirements
Physical
Components
Startup Sequence
Writing an
Instrumented Device Driver
Running the
Components
Conclusion
Introduction
With the release of the Microsoft Windows CE Add-On Pack and System Analysis Tools for Platform Builder 3.0 (Add-On Pack), Microsoft has introduced new tools to help third-party developers visually understand what is occurring on remote Windows CE devices. These new tools visually display data that was previously unavailable to third-party developers. A tool that is significant in this respect is Remote Performance Monitor (CEPerfMon). CEPerfMon is a version of the Microsoft Windows NT Performance Monitor that can connect to a remote Windows CE device.
The purpose of this document is to help developers leverage the power of the CEPerfMon Extension Model to instrument Windows CE device drivers. The Extension Model allows third-party developers to add Windows CE performance objects. Windows CE performance objects are sets of logically related performance counters. For example, a parallel port performance object might include such performance counters as bytes written per second and total errors.
Even though this document addresses instrumenting Windows CE device drivers, any remote Windows CE component, for example, COM object and DLL, can be instrumented to display data in CEPerfMon by leveraging the CEPerfMon Extension Model.
Requirements
The requirement for building a device driver that can be instrumented via the CEPerfMon is having the Add-On Pack installed.
All sample Windows CE binaries accompanying this document were compiled for an x86 Windows CE PC-based hardware development platform (CEPC). A CEPC is required to run the sample binaries. The source code for the CEPC binaries is also available and can be rebuilt for any supported platform.
Physical Components
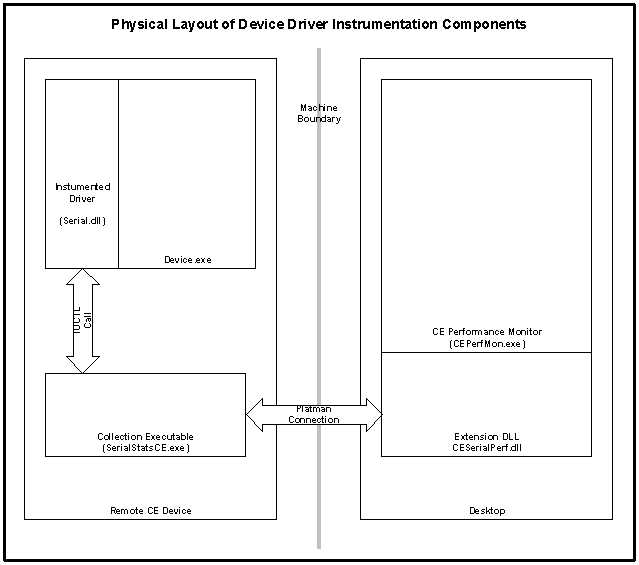
Instrumenting a device driver with CEPerfMon requires these physical components:
-
Instrumented Device Driver
This is a Windows CE device driver that can be queried via an IOCLT call, or other IPC method, for performance data. The driver should keep internal statistics for any interesting data needed for performance monitoring. The driver developer should publish an interface, for example an IOCTL method, allowing other Windows CE processes to query the device driver for this data as needed.- Data Collector
This is a Windows CE executable that can query the device driver for performance data on demand. The Data Collector is downloaded on demand by the Extension DLL. The Extension DLL sends requests to the Data Collector for performance data via a Platform Manager connection.- Extension DLL
Extension DLLs are desktop components that adhere to the CEPerfMon Extension Model. The Extension Model allows the addition of performance objects, which are sets of logically related counters, to CEPerfMon.Extension DLLs are located using registry information generated by CEPerfMon. Once located, they are loaded by CEPerfMon and asked to initialize. During initialization, Extension DLLs download and start their remote data collectors.
Extension DLLs for the CEPerfMon Extension Model are similar to Extension DLLs for the Windows NT Performance Monitor Extension Model except in two respects: Windows CE Extension DLLs register themselves differently in the registry and must export and function in ways not required by Windows NT Extension DLLs.
Windows CE Extension DLLs register themselves under the HKLM\Current Control Set\Services\<Extension Name>\Performance key. They place the location of the DLL in the "CEPerfLib" string value. NT Extension DLLs place their location in the "PerfLib" string value.
All Extension DLLs export three entry points: Open, Collect and Close. Windows CE Extension DLLs must export an additional entry point: SetITLConnection. This is called by CEPerfMon to pass its remote device connection to the Extension DLL. The Extension DLL uses this device connection to launch and connect to its Data Collector.
Note MSDN, the Microsoft Developer Network, contains many references on writing Windows NT Extension DLLs. Windows CE–specific differences are addressed in Platform Builder online Help.

Startup Sequence
The following is the startup sequence showing the order of component interactions during the display of device driver performance data:
- A user starts a remote Windows CE device that is connected to the desktop via an Ethernet, serial, or parallel connection.
- The device boots successfully and the instrumented device driver is loaded.
- The device driver accumulates performance data as interesting events occur.
- The user launches Platform Builder and starts CEPerfMon from the Toolsmenu.
- The user selects Connect/Connect To Devicefrom the Toolsmenu and successfully connects to the remote device.
- Once connected, CEPerfMon loads the required Extension DLL and passes it a device connection.
- The Extension DLL uses the device connection to launch and connect to its Data Collector.
- The user selects the +button from CEPerfMon, selects the device driver's performance object, and adds performance counters to the display.
- At each CEPerfMon update interval, the Extension DLL is asked to gather performance data.
- Upon request for performance data from CEPerfMon, the Extension DLL calls its Data Collector.
- Upon receiving a performance data request, the Data Collector
calls the IOCTL into the device driver to gather the data.
The data is returned to the Extension DLL.
- The Extension DLL formats the performance data according to the Extension Model data formats and returns the data to CEPerfMon.
- CEPerfMon graphs the data in the display.
Writing an Instrumented Device Driver
Writing an instrumented device driver and its accompanying Data Collector and Extension DLL is simplified by leveraging the sample code that ships with the Add-on Pack. The Add-on Pack contains a simple Data Collector and Extension DLL sample, which can form the foundation of your Data Collector and Extension DLL.
For illustration, the accompanying sample code contains an instrumented sample serial device driver. This sample is a modified version of the serial driver that ships with Platform Builder.
The accompanying sample code also contains a Data Collector and Extension DLL modified from the sample base for the serial performance project. Once all the components are built and installed, you can view serial performance data from CEPerfMon.
The topics "Building the Device Driver" and "Installation Process" walk you through the steps necessary to build the instrumented serial components to illustrate how you can build your own components. The accompanying sample code contains the sources and CEPC binaries needed to run the instrumented serial driver.
Because all necessary binaries are included in the accompanying sample code, building the components is not necessary for installing them and running them.
Accompanying Sample Code
To run or build the sample code, the sample tree must be copied into your existing Platform Builder directories.
To install the serial performance sample
- Copy the contents of the Sample\$(CEPBDir) directory into the
directory denoted by the "CEPBDir" environment variable.
This is set by the Platform Builder installation.
- Copy the contents of the Sample\($_WINCEROOT) directory into
the directory denoted by the "_WINCEROOT" environment variable.
This is also set by the Platform Builder installation.
Sample directory contents
- $(_WINCEROOT)\Public\Common\Oak\Drivers\MySerial
The instrumented serial library source code.
- $(_WINCEROOT)\Public\Common\Oak\LIB\X86\I486\Ce\Debug
The serial library and *.pdb file.
- $(CEPBDir)\Samples\Serialperf\Desktop
The Windows CE Extension DLL Microsoft Visual Studio 6.0 project.
- $(CEPBDir)\Samples\Serialperf\Device
The Windows CE device-side data collector Microsoft eMbedded Visual Tools 3.0 project.
- $(CEPBDir)\Samples\Bin\CESerialPerf.dll
The debug Extension DLL binary.
- $(CEPBDir)\Samples\Bin\SerialStatsCE.exe
The debug data collector for x86 CEPC.
- $(CEPBDir)\Samples\Bin\Serialstatsce.ini
The package registration file for SerialStatsCE.exe.
- $(CEPBDir)\Samples\Bin\Install.bat
A simple installation script.
Building the Device Driver
Because Platform Builder ships sample code for the existing CEPC serial driver, it was easy to use the sample code to build a driver that could be instrumented. The serial driver is divided into two parts: the model device driver (MDD) and the platform-dependent driver (PDD) The MDD is the platform-neutral layer of a native device driver supplied by Microsoft. The PDD is the platform-specific layer of a native device driver supplied by an original equipment manufacturer (OEM).
The MDD layer for the serial driver exists in a library called COM_MDD.lib. The source code for this library lives in $(_WINCEROOT)\Public\Common\Oak\Drivers\Serial. It is built from one source file, MDD.c. It is linked into the serial driver, Serial.dll, when the Windows CE platform is built from Platform Builder.
The following functionality was added to COM_MDD.lib:
- Each serial write updates a global counter that contains the number of writes since the device driver has loaded.
- Each serial read updates a global counter that contains the number of reads since the device driver has loaded.
- An IOCTL method has been added to query the total number of
reads and writes.
The following IOCTL and data structure were defined to form the interface between the device driver and the Data Collector:
//////////// Structure to hold reads and
writes//////////// typedef struct _tagSERIAL_STATISTICS { DWORD
dwBytesRead; DWORD dwBytesWritten;
}SERIAL_STATISTICS,*PSERIAL_STATISTICS; // IOCTL that Data
Collector can call to get read and write totals #define
IOCTL_SERIAL_GET_STATISTICS
CTL_CODE(FILE_DEVICE_SERIAL_PORT,24,METHOD_BUFFERED,
FILE_ANY_ACCESS)
////////////////////////////////////////////////////////////////
Once the following changes were made to MDD.c, the COM_MDD.lib was ready to be rebuilt. This required creating a command-line build environment for the CEPC platform. This was done by running "cmd.exe /k wince.bat x86 i486 CE MYPROJ CEPC" out of the $(_WINCEROOT)\Public\Common\Oak\Misc directory. The next step was to set the following environment variable to designate a debug build environment: "WINCEDEBUG=debug." This created a debug command-line build environment for the CEPC platform.
Now the COM_MDD.lib library can be built by calling "build" at the command prompt while in the MySerial directory. This creates COM_MDD.lib and COM_MDD.pdb in the following directory: $(_WINCEROOT)\Public\Common\Oak\Lib\X86\I486\Ce\Debug.
Once the library is built, it must be copied to the Oak\Lib directory of an the existing CEPC platform (For more information, see creating and building platforms in Platform Builder online Help.) For example, if you have created a maximum operating system (OS) configuration (Maxall) CEPC platform named MyMaxAll, copy the newly created COM_MDD files into the $(_WINCEROOT)\Public\MyMaxAll\WINCE300\Cesysgen\Oak\Lib\x86\i486\Ce\Debug directory. Then, rebuild the platform to ensure that Serial.dll is rebuilt linking to the new version of COM_MDD.lib.
The end result of this process is a CEPC OS configuration that includes an instrumented serial driver.
Building the Data Collector
You can start with the sample Data Collector that ships with the Add-on Pack. The sample resides in the $(CEPBDir)\Samples\Ceperf\Device directory. The sample currently gathers the current tick count and returns it to the Extension DLL when queried.
The accompanying sample Data Collector was made by copying the sample in a sibling directory and renaming the output file to SerialStatsCE.exe. The next step was renaming and changing the GUID used to identify the Platform Manager connection from the Data Collector to the Extension DLL. The final step was changing the data collection command from gathering the current tick count to calling the serial driver IOCTL to collect the serial read and write totals.
Once the code changes were complete, the sample could be built for Windows CE x86 debug using the eMbedded Visual Toolkit 3.0.
Building the Extension DLL
This portion is the most tedious part of the project. Although, it is beyond the scope of this paper to address the specifics of writing Extension DLLs, we will cover several salient points.
The Extension DLL sample, $(CEPBDir)\Samples\Ceperf\Desktop, has numerous "TODO" comments laced throughout as pointers to where project-specific code must be changed. It may be useful to compare the original sample code with the serial Extension DLL to see the project-specific areas that must be changed. The process of making such comparisons is called "diffing."
The bulk of the work is in creating the data structures that define the performance counters. The accompanying sample Extension DLL contains four performance counters: total bytes read, total bytes written, bytes read per second, and bytes written per second. The definition of these new counters is reflected in various changes across the project.
The last step is to copy the Perfgen.ini file from the Samples/Bin directory into the Extension DLL project director, and then add the new defines (in Genctrnm.h) and help strings for the performance counters.
Note It is to compare the accompanying sample Extension DLL with the original Platform Builder Extension DLL sample. The file names have intentionally been left the same to facilitate programs that make such comparisons. The differences show you the areas of code that you must change to customize an Extension DLL.
Installation Process
There are three steps involved in registering the components:
- Registering the Extension DLL in the registry.
- Registering the Extension DLL Help strings.
- Registering the Data Collector as a device-side component of
CEPerfMon.
The above steps are accomplished by running the Install.bat program in the accompanying Samples directory.
Registering the Extension DLL
Extension DLL installation is done by calling Regsvr32 on the Extension DLL.
Registering the Extension DLL Help strings
The Help strings are defined in Pefgen.ini. To load the Help strings into the registry, run the following command:
Lodctr Perfgen.ini
To unregister the Help strings, run Unlodctr with the driver name defined in Perfgen.ini. Because the serial performance driver name is CESERIALSTATS, the command to unregister the serial performance Help strings is:
Unlodctr CESERIALSTATS
Registering the Data Collector
Windows CE tools support packages. A packageis a collection of Windows CE binaries that must be present on a remote device for a desktop component to run. Once a package is registered, Platform Manager ensures that the remote components get properly downloaded when the desktop component attempts to connect to a device.
Registering the Data Collector as part of the CEPerfMon package ensures that the Data Collector will be downloaded to the device if it is not already on the device when CEPerfMon connects to the device.
Here is a simple package *.ini file named Serialstatsce.ini for the data collector:
******************SAMPLE PACKAGE INI
FILE********************* [globals] Path=G:\Program Files\Windows
CE Platform Builder\3.00\Samples\Bin
UninstallINI=.\SerialStatsCEUninstall.ini [Main] Platforms=1
Platform1=CEPB 3.0 Default Device [CEPB 3.0 Default Device]
ID={7EBA12E4-0259-46FD-A743-10C7B027C093} Packages=1
Package1=SerialStats [SerialStats] Name=Windows CE Performance
Monitor ID={5933A3BA-669B-4AB3-A98E-77E654EB21DB} Files=1
File1=SerialStatsCE.exe LocFiles=0 Processors=1 Processor1=I486
[I486] Architecture=0 ProcessorLevel=0 PageSize=4096 CPUType=486
Path=<PATH>\
***************************************************************
The .ini file and the Data Collection .exe file are then placed in the Sample\Bin directory and "REGPKG.exe Serialstatsce.ini" is then called. This registers the Data Collection .exe file as part of the CEPerfMon package.
Running the Components
Once all the components are built and registered, you are ready to view serial performance data via CEPerfMon.
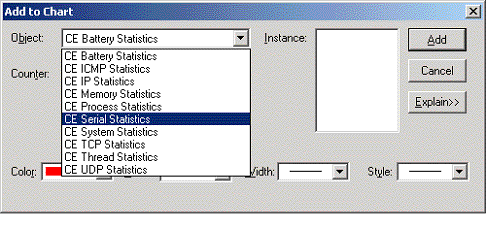
You first launch the CEPC device and download the OS image containing the instrumented serial driver. Once the device starts, launch the CEPerfMon from the Toolsmenu. Connect to the remote device by selecting the device from Connect/Connect To Deviceon the Toolsmenu. Connect to the default, PB 3.0 device. Once connected, select the +button from the toolbar. The following illustration shows CE Serial Statisticsas a performance object choice.

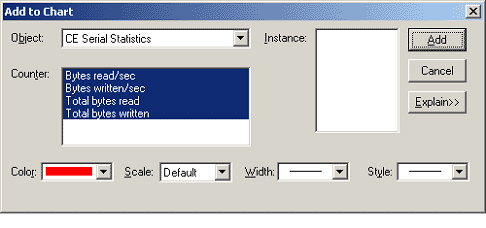
Once the CE Serial Statisticsobject is selected, the performance counters will be available for selection.

Then, select all performance counters, and select Addand then Doneto add the counters to the current CEPerfMon session.
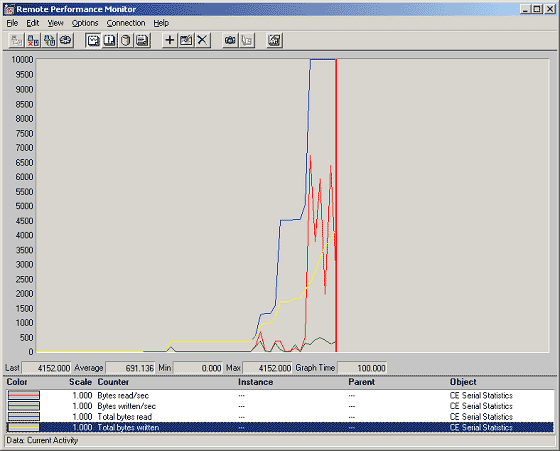
The following illustration shows a view of the serial performance counters displayed in CEPerfMon when the CEPC connects to the Internet via a serial connection. The serial performance data is displayed in CEPerfMon Graph view.

Conclusion
Instrumenting device drivers and such other performance-critical applications as performance objects can help developers tune development. Making the performance data available to customers can help gather remote-site feedback that would not otherwise be available. Quality assurance engineers can also benefit from having a visual display and recording application for remote performance.
In addition, CEPerfMon provides a Logging view to allow data collection over extended periods and an Alert view to bind the execution of a task to a performance event. The ability to display various types of data, for example, textual, further broadens the types of applications and tools that can benefit from CEPerfMon services.
- $(_WINCEROOT)\Public\Common\Oak\Drivers\MySerial
- Copy the contents of the Sample\$(CEPBDir) directory into the
directory denoted by the "CEPBDir" environment variable.
- Data Collector