 Important: Important: |
|---|
| This is retired content. This content is outdated and is no longer being maintained. It is provided as a courtesy for individuals who are still using these technologies. This content may contain URLs that were valid when originally published, but now link to sites or pages that no longer exist. |
Microsoft Corporation
April 2000
Summary:This document discusses in detail the Platform Builder debugging environment for the Microsoft Windows CE operating system, which includes new integrated development environment (IDE) features, the use of newly integrated Windows CE debug shell (CESH) functionality, and eXdi hardware-assisted debugging. (23 printed pages)
Contents
Introduction
Kernel debugging in Platform Builder 3.0 is simpler, cleaner,
and better performing than ever before. Once you have built your
Microsoft Windows CE operating system–based platform, you can
download your image and start debugging with a single click of the
mouse. This paper discusses in detail the Platform Builder
debugging environment, including new integrated development
environment (IDE) features, the use of newly integrated Windows CE
debug shell (CESH) functionality, and eXdi hardware-assisted
debugging. Platform Builder uses a kernel debugger for debugging embedded
platforms. The kernel debugger differs from the application
debugger in the following ways:
You can use the kernel debugger to debug application code in the
Windows CE kernel. The kernel debugger starts automatically if you
have enabled kernel debugging in the Platform Settings dialog box.
If enabled, the debugging stub,
KdStub, is included in the operating system image that is
downloaded to the target device. In addition to improved debugging performance, the following new
features are included in this release:
Each of these windows is discussed later in this document.
For example, you can drag a variable from the Variables window
to the Watch window. This action puts the variable information into
the Watch window, where it is updated each time that the Watch
window is updated. If you drag the variable to a text window
instead, the variable information is converted into text. If you
drag the variable to the Memory window or the Disassembly window,
the variable is used as a pointer, and the window scrolls to
display the memory contents or instructions at the indicated
address.
If you expand an object in the Variables window, you can drag a
member of that object to the Watch window.
Spreadsheet fields contain controls for viewing of array,
object, structure, and pointer variables. If the variable is a
pointer, the branch immediately below the pointer contains the
value that is pointed to. If the variable is an array, an object,
or a structure, the branch below the variable contains the
component elements or members.
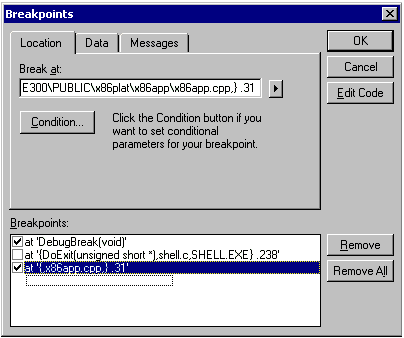
Figure 1. The Breakpoints dialog box
The kernel debugger requires a dedicated physical transport.
Typically this transport is either a serial connection or an
Ethernet connection and is supplied on an add-on debug board
provided by an original equipment manufacturer (OEM). However,
these debug boards are not available on all devices, and typically
they are not provided to independent software vendors (ISVs) by an
OEM. To address this, an OEM I/O controller has been defined that
you can use to dynamically switch a standard port, such as COM1,
from normal mode to debug mode. This section describes the basic
mechanism for implementing this feature. The IOCTL_SET_KERNEL_DEV_PORT is defined in Pkfuncs.h. Once you
have fully implemented this I/O controller, you can create an
application that dynamically switches a port between standard mode
and debug mode by means of the I/O controller. A Windows CE PC–based hardware development platform (CEPC)
defines eight unique port identifiers: KERNEL_PORT_NONE,
KERNEL_PORT_COM1, KERNEL_PORT_COM2, KERNEL_PORT_COM3,
KERNEL_PORT_COM4, KERNEL_PORT_LPT1, KERNEL_PORT_LPT2, and
KERNEL_PORT_ETH1. You must define only the available ports and
PORT_NONE for a device. Not all services need to be supported. For example, a basic
implementation might support only mapping the kernel debugger to
the primary serial port. An advanced implementation might also
allow mapping any kernel service to a built-in Ethernet port. Because switching ports for a mode is best accomplished by
rebooting, the first step in implementing the DEV_PORT is to
provide an area to store the requested mode that is preserved when
you reboot, such as the driver global or other reserved area of
memory. Three bytes are required for storage—one byte for each
kernel service. Each byte contains the port identifier of the port
that is used by that service. Once each service is configured for the appropriate port, the
IOCTL_OAL_REBOOT I/O controller is used to force a warm boot. Upon
rebooting, the OAL should examine the arguments area that was set
by IOCTL_SET_KERNEL_DEV_PORT. The exact implementation of this will
depend on the ports that are supported. For example, a CEPC
determines which serial port should be used for initial debugging
of messages by checking the
bootargsstructure in the
OEMInitDebugSerialfunction in
%_WINCEROOT%\Platform\Cepc\Kernel\HAL\X86\Debug.c. The Processes window is a dockable window that displays
information on all processes running on the target device. When the
Processes window is initially opened, it displays an alphabetical
list of all processes running on the target device. The Processes window provides different information, depending
on whether the debugger is running or at a debug stop or
breakpoint. When both the debugger and Target Control (CESH) are
disconnected, the Processes window closes. The kernel debugger is started automatically within Platform
Builder when a debugger-enabled image is downloaded to the target.
The Process window is populated from two different sources,
depending on the state of the target. When the target is running,
the Process window obtains information through CESH.exe. When the
target is in a break state, the debugger stub on the target
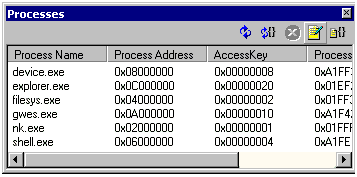
provides information to the Process window. Figure 2 below shows what the Processes window looks like when
the kernel debugger is attached to the target device, the target
device is currently running, and Target Control (CESH) is currently
running.
Figure 2. The Processes window
The Threads window is a dockable window that displays the
threads,or paths of execution, within a process. Like the
Process window, the Threads window is populated from a different
source depending on the state of the target, and the information
displayed in the Threads window will vary based on the current
state. When the target is running, the Target Control (CESH)
service provides the information for this window; note that if the
Target Control service is not running, this information will not be
available. If the target is in a break state, the debugger stub in
the kernel provides the information necessary to fill the contents
of this window. By default, when the Threads window is first
opened, it displays the threads for the first process listed in the
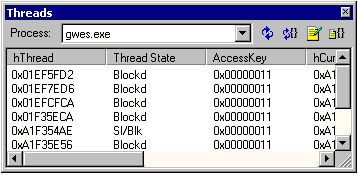
Process combo box. Figure 3 below shows what the Threads window looks like when the
kernel debugger is attached to the target device, the target device
is currently running, and Target Control (CESH) is currently
running.
Figure 3. The Threads window
Table 1 below shows some of the exceptions that the kernel
debugger can handle.
Table 1. Debugger exceptions-handling
SH3: 0x0e0, 0x100 SH3: 0x40, 0x60, 0xa0, 0xc0 SH3: 0x160 SH3: 0x180, 0x1a0 Use the
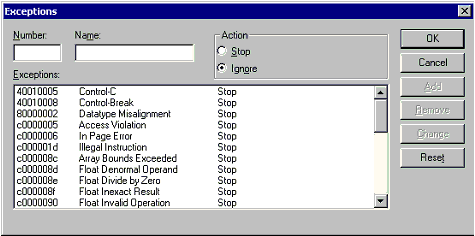
Exceptionsdialog box (Figure 4 below) to control how the
debugger handles exceptions. The
Exceptionsdialog box displays system-defined and
user-defined exceptions and their actions for your project.
Figure 4. TheExceptions
dialog box Use the Watch window to specify variables and expressions that
you want to watch while debugging your program. You can also modify
the value of a variable in the Watch window. The Watch window contains four tabs:
Watch1,
Watch2,
Watch3, and
Watch4. Each tab displays a user-specified list of variables
and expressions in a spreadsheet field. You can group variables
that you want to watch together onto the same tab. For example, you
could put variables related to a specific window on one tab and
variables related to a dialog box on another tab. You could watch
the first tab when debugging the window and the second tab when
debugging the dialog box. The Watch window displays values in their default format. You
can change the display format—to display Unicode characters, for
example—by using formatting characters. In addition to the global variables of the current process, you
can also review global variables of any module that is loaded, if
you qualify the name with the context operator. For example, no
matter what the current process is, you can examine the
PROCARRAYstructure in the kernel by typing a command in a
Watch window. You can review a module by casting a thread address. If you want
to look at the thread structure for the Shell.exe process from the
Processescommand output, you can type a command in the Watch
window. The Watch window does not display variable type information. You
can view information for a variable type by using the window's
property page. The
QuickWatchdialog box contains a text box, where you can type
an expression or variable name, and a spreadsheet field that
displays the current value of the variable or expression that you
specified. You can use the
QuickWatchdialog box to examine the value of a variable or
expression. You can also use the
QuickWatchdialog box to modify the value of a variable or to
add a variable or expression to the Watch window. The
Current Valuespreadsheet field displays only one variable or
expression at a time. If you type a new variable or expression in
the text box, and then press ENTER, the previous variable or
expression in the
Current Valuefield is replaced. The
QuickWatchdialog box displays values in their default
format. You can change the display format—to display Unicode
characters, for example—by using formatting characters. The Variables window provides quick access to variables that are
important in the program's current context. The window includes
three tabs:
Each tab contains a spreadsheet with fields for the variable
name and value. The debugger automatically fills in these fields.
If a value appears in red, it indicates that the value has recently
changed. Only the last value to change appears in red. You cannot add variables or expressions to the Variables
window—you must use the Watch window—but you can change the value
of a variable by double-clicking on its
Valuefield and entering new data. In addition to the tabs, the Variables window has a context box
on the toolbar that contains a copy of the current call stack in a
drop-down list box. Use this list to specify the current scope of
the variables that are displayed. You can hide the
Contextlist by right-clicking in the Variables window, and
then clearing the
Toolbarcheck box. You can navigate to a function's source code or disassembled
object code from the
Contextlist. This procedure displays the function's source
code, if it is available, in a source window. If source code for
the selected function is not available, it displays the function's
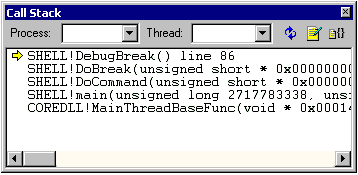
object code in the Disassembly window. During a debug session, the Call Stack window (Figure 5 below)
displays the stack of function calls that are currently active.
When a function is called, it is pushed onto the stack. When the
function returns, it is popped off the stack.
Figure 5. The Call Stack window
The Call Stack window displays the currently executing function
at the top of the stack and older function calls below that
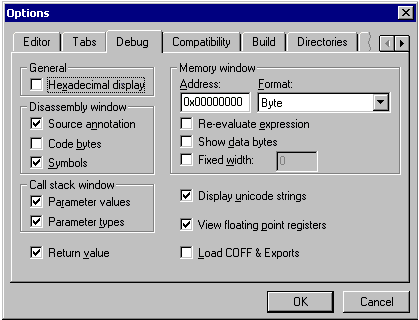
function. By default, the window also displays parameter types and
values for each function call. You can display or hide parameter
types and values by using the
Debugtab in the
Optionsdialog box (as shown in Figure 6 below) or the
shortcut menu.
Figure 6. TheDebug
tab in theOptions
dialog box The
Processlist box in the Call Stack window contains a CURRENT
selection. If the user selects Current, the Call Stack window
displays the call stack of the current process and thread. You can
also select call stacks by specifying Process and Thread names. You can navigate to the source code or disassembled object code
for a function by double-clicking the function in the Call Stack
window. If source code for the selected function is not available,
the object code is displayed in the Disassembly window. Navigating to a function's code changes how the view of the
program is shown in the Variables window and other debugger
windows, but does not change the context of the target, which is
either the next line of execution or the value that is stored in
the program counter. The functions are listed in the order that they are called with
the current function at the top. The
Contextlist in the Variables
window also contains call stack functions. The Disassembly window and the Source window provide different
views of the code that is running on the target device. It is also
possible to view code in mixed source and disassembly mode. The Disassembly window is a dockable window that operates on
disassembled (assembly-language or bytecode) instructions instead
of source-code statements or lines. By using the Disassembly
window, you can set a breakpoint on any instruction. If you use the
Step Intoor
Step Overcommand while the Disassembly window has focus, the
debugger steps through your program instruction-by-instruction
instead of line-by-line. Viewing and stepping through your code by
disassembled instructions can be especially useful when you are
debugging optimized code or source code lines that contain multiple
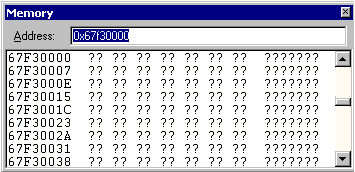
statements. The Memory window displays a snapshot of the data in memory at a
given address. You can change the display format by using the
shortcut menu. Figure 7 below shows the Memory window with its
display in byte format.
Figure 7. The Memory window in byte format
The Registers window displays core CPU registers. You can change
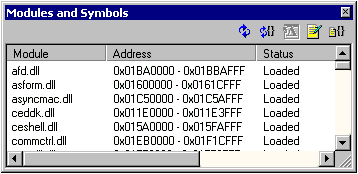
the display format by using the shortcut menu. The Modules and Symbols window (Figure 8 below) is a dockable
window that displays the name, address, status, and path for each
module that is loaded into memory. Only one instance of this window
can be open at a given time.
Figure 8. The Modules and Symbols window
The information displayed in the Modules and Symbols window
varies, depending on the state of the target device, the services
running on the device, and the kernel debugger. The symbols for
individual modules can be unloaded by selecting a particular module
and then clicking the Unload Module tool bar button in the Modules
and Symbols window. The Windows CE operating system kernel provides debugging
support for applications, including printing debugging messages and
registering
debug zones. Debug zones allow you to debug by enabling
macros that control the output of debugging messages. To use debug zones, first define each debug zone to a bitmask
and initialize it in the application source code. The application
programming interface (API) for debug zones is included in the
Dbgapi.h header file. You can define up to 16 debug zones in one
application. After defining a debug zone to a bitmask, associate a
debug zone maskname with the defined bitmask. A debug zone
mask is a named bitmask that is used to turn a debug zone on or
off. Implement the debug zones and debug zone masks by declaring a
DBGPARAMstructure in the source code.
DBGPARAMholds the debug output information by setting the
global variable
dpCurSettings. After declaring the
DBGPARAMstructure, call the
DEBUGREGISTERmacro to register the structure with the
debugging subsystem. The syntax for this macro is
DEBUGREGISTER(
hMod|
NULL). If you are debugging a DLL file, call
DEBUGREGISTERwith the module name. If you are debugging an
EXE file, call
DEBUGREGISTERwith
NULL. The
DEBUGREGISTERmacro calls
RegisterDbgZones. On the development workstation,
RegisterDbgZonesreads the registry key
HKEY_CURRENT_USER\Pegasus\Zonesand searches for the module
name, specified in the
DBGPARAMmacro. If the key exists,
RegisterDbgZonescalls
SetDbgZone, which uses the stored debug zone mask to update
the debug zone name in the
DBGPARAMmacro. For additional information and code samples, see the Platform
Builder 3.0 online documentation. The
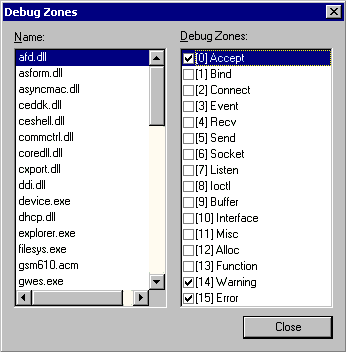
Debug Zonesdialog box (shown in Figure 9 below) enables you
to view debug zones for processes and modules. You can also turn
debug zones on and off from this dialog box.
Figure 9. TheDebug Zones
dialog box The
Debug Zonesmenu item and button are enabled only in the
following circumstances.
Debug zones are not enabled if the target device is empty, at a
debug stop, Target Control (CESH) is not running, or if the kernel
debugger is not attached to the target device. After the debug zones are registered, use macro calls in the
source code to output debugging messages. Release and debug
configurations call different macros. Release configurations use the following macros:
To enable the debug macros, you must build a debug
configuration. Debug configurations use the three retail macros
listed above, as well as the following debug macros:
Platform Builder enables you to use eXdi hardware–assisted
debugging to control the execution of a target device, and to
examine and modify the state of the device. Third-party vendors
provide the required hardware and software, which includes at least
a driver and either a probe or an emulator. The third-party vendor
may also provide a target device, or the target and probe may be
one piece of hardware, and a software plug-in that adds additional
hardware specific functionality to the debugger. Platform Builder
provides an IDE interface to the third-party components. To use eXdi hardware–assisted debugging, you must install the
third-party eXdi driver on a development workstation running
Platform Builder, and connect a probe or emulator between the
development workstation and the target device. The driver
multiplexes all communication between the probe or emulator and all
clients, including Platform Builder and debugger plug-ins. The same
driver can sometimes support multiple CPUs, even those from
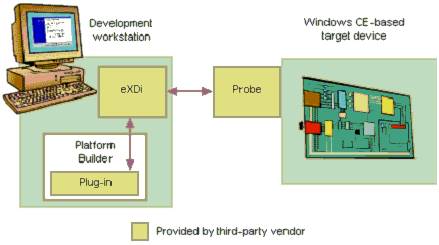
different CPU families. Figure 10 is an illustration showing a typical eXdi hardware
debugging configuration that uses a probe.
Figure 10. Typical exDi hardware debugging configuration
The eXdi driver works solely with the debug support available on
the hardware, and does not rely on an operating system for this
support. For this reason, the hardware debugger can work even if
the operating system is not fully functional, or even if there is
no operating system on the target device. The hardware debugger can
debug initialization phases such as hardware setup, boot loading,
and OEM adaptation layer (OAL) initialization, as well as OAL
routines and the kernel itself. It can also be used to debug other
kinds of code, although the kernel debugger may be more appropriate
and is recommended. Although the hardware debugger does not rely on an operating
system, some hardware debugging features are relevant or available
only when the Windows CE kernel is running. The following benefits are offered by eXdi hardware debugging:
Table 2 below shows the differences between eXdi hardware
debugging and kernel debugging with a kernel debug stub,
KdStub.
Table 2. Comparison of eXdi hardware debugging and kernel
debugging
By default, Platform Builder loads only one Nk.exe module. This
means that, by default, only Nk.exe can be debugged with sources
and symbols. However, there are ways to get more module loads. The eXdi driver can return the information to Platform builder,
provided the kernel tables are current and the driver matches the
version of the kernel. If this capability is not supported, contact
the driver vendor for an update. You can manually edit the registry key
HKEY_LOCAL_MACHINE\SOFTWARE\Microsoft\Platform
Builder\3.0\Hardware Debug\BinImageto force more modules to
load.
© 2000 Microsoft Corporation. All rights reserved.
The information contained in this document represents the
current view of Microsoft Corporation on the issues discussed as of
the date of publication. Because Microsoft must respond to changing
market conditions, it should not be interpreted to be a commitment
on the part of Microsoft, and Microsoft cannot guarantee the
accuracy of any information presented after the date of
publication.
This white paper is for informational purposes only. MICROSOFT
MAKES NO WARRANTIES, EXPRESS OR IMPLIED, IN THIS DOCUMENT.
Microsoft, Visual Basic, Visual C++, the eMbedded Visual Tools
logo, Windows, and Windows NT are either registered trademarks or
trademarks of Microsoft Corporation in the United States and/or
other countries.
Other product and company names mentioned herein may be the
trademarks of their respective owners.
Microsoft Corporation, One Microsoft Way, Redmond, WA 98052-6399
USA
4/00
Kernel Debugging vs. Application
Debugging
Using the Kernel Debugger
Kernel Debugging Using Standard
Ports
Obtaining Process Information
Obtaining Thread Information
Handling Exceptions
Watching Variables and Expressions
Displaying Function Calls
View Disassembly and Source Code
Viewing Memory and Registers
Working with Modules and Symbols
Using Debug Zones
Calling Debugging Macros
Using eXdi Hardware-Assisted Debugging
Introduction
Kernel Debugging Using Platform Builder 3.0
Kernel Debugging vs. Application
Debugging
Using the Kernel Debugger
Kernel Debugging Using Standard
Ports
IOCTL_SET_KERNEL_DEV_PORT
Handling the I/O Controller
Enabling the Service
Obtaining Process Information
Obtaining Thread Information
Handling Exceptions
Exception
Microprocessor exception
Description
STATUS_DATATYPE_MISALIGNMENT
MIPS: 4, 5
An address is unaligned. Verify that all data
references are aligned and that the process is in the correct mode,
either User or Kernel.
STATUS_ACCESS_VIOLATION
MIPS: 1, 2, 3
An attempt was made to access data through an
invalid pointer or you do not have permission to access the object
to which the pointer refers.
STATUS_BREAKPOINT
MIPS: 9
A breakpoint was generated by a call to the
DebugBreakfunction.
STATUS_ILLEGAL_INSTRUCTION
MIPS: 10
The microprocessor has tried to execute an unknown
instruction or an instruction that is invalid in a delay slot. This
exception will only be encountered if you are writing assembly
language code.
STATUS_INVALID_DISPOSITION
NA
The structured exception-handler code called a
handler to handle an exception, but the handler returned an
erroneous or unknown disposition.
Watching Variables and
Expressions
The QuickWatch Dialog Box
Watching Program Variables
Displaying Function Calls
Viewing Disassembly and Source Code
Viewing Memory and Registers
Working with Modules and Symbols
Using Debug Zones
Defining Debug Zones
Declaring a DBGPARAM Structure
Registering Debug Zones
Using the Debug Zones Dialog Box
Calling Debugging Macros
Using eXdi Hardware–Assisted
Debugging
Benefits of eXdi Hardware Debugging
eXdi Hardware Debugging vs. Kernel Debugging
eXdi Hardware Debugging
KdStub Kernel Debugging
Does not rely on target-side debug routines. Can
debug in every situation, just out of reset, provided the probe and
the on-chip debug hardware, if applicable, are working and are not
disrupted by the target application itself; for example, by
accessing debug registers. Operates non-intrusively and
independently of the kernel state.
Relies on KdStub to capture exceptions and
breakpoints, access kernel information, request some kernel
operations, communicate with the debugger, and restart the debugged
code. Operates relatively intrusively and dependently.
Gets module information from the .bin file that is
downloaded to the target device. Gets the first module, usually
Nk.exe for the kernel module file, load address, and data
relocation address.
Finds the location of symbols dynamically, at run
time through kernel-generated load and unload notifications.
May be able to read or write memory, registers, or
breakpoints while running, depending on the type of target and
probe being used.
Cannot read or write memory, registers, or
breakpoints while running.
Choosing
Breakfrom the
Debugmenu results in an asynchronous break at the exact
current execution location.
Choosing
Breakfrom the
Debugmenu results in calling a DebugBreak() in Shell.exe, a
process on the target device. This implies that the Shell.exe
threads are running. DebugBreak() contains a software breakpoint
that is trapped by the Windows CE kernel and led to invoke
KdStub.
When the target device is running, the Process and
Thread windows can be populated by querying the Shell.exe process
on the target device. However, the Process and Thread windows may
not be available when the target is halted, depending on the eXdi
driver. If this is the case, contact the driver vendor for an
update. In both cases, the Windows CE operating system needs to be
initialized properly.
When the target device is running, the Process and
Thread windows are populated by querying the Shell.exe process on
the target device. When the target device is halted, those windows
are populated by querying KdStub. Therefore, these windows are
always available.
The call stack does not go across processes. It is
limited to the current process.
The call stack can be walked across processes by
following interprocess communication (IPC) calls, similar to
PSL.
The reduced intrusiveness of the eXdi hardware
debugger has some side effects. For example, the target cannot, at
the debugger's request, commit virtual memory pages that are not
already committed by the operating system, running the target code.
Therefore, the debugger cannot always read or write memory, or set
software breakpoints, on any locations of a process space that has
page-on-demand enabled. However, this is not the case for Nk.exe,
and page-on-demand can be disabled globally for all other
modules.
KdStub calls kernel routines, even when halted, to
page in any virtual memory pages it needs to access.