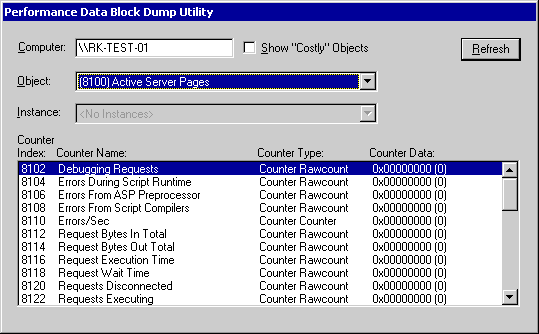

ShowPerf User Interface |
|
| Run Tool | |

The Computer box displays the name of the computer being monitored. The default is the local computer.
To monitor a remote computer, delete the name in the Computer box, type the name of the remote computer (preceded by backslashes), and click Refresh.
Select the Show "Costly" Objects ch box if you want Showperf to load these objects, or clear it if you don't want Showperf to load them. This box is cleared by default.
After selecting or clearing this check box, click Refresh to make the change effective.
The Object box displays the performance object being monitored and its index in the performance registry. Typically, performance objects represent components of the operating system or its services.
The Object drop-down list displays all performance objects enabled and operating on the system. If an object does not appear in the list, it might be faulty or disabled.
When you select an object, its instances appear in the Instances list and its counters appear in the Counter display.
To monitor a different performance object, select the object from the drop-down list.
Note
The Instance box displays the instance of the performance object being monitored, or Total, which represents all instances of the object.
The Instance list is used when the computer has more than one component of the same type. For example, when the computer has more than one disk drive and you monitor the PhysicalDisk object, the Instance box lists each drive.
To monitor a different instance of the selected object, select an instance from the drop-down box.
To interpret the Counter display
The following table lists and describes the fields in the Counter display.
| Item | Description |
|---|---|
| Index | The index of the counter in the performance registry. The index of a performance counter must be within the index range assigned to the performance object. |
| Counter Name | The name of the performance counter. |
| Counter Type | The counter type defines the method used to calculate, average, and display counter data. If a counter is not displaying the correct data, it might have the wrong counter type. For example, if a counter is displaying instantaneous values, instead of values per second, it might be of type Counter Rawcount instead of Counter Counter. |
| Counter Data | The current, unformatted content of the data block for the counter. Click Refresh to update the data. |