|
|
< Day Day Up > |
|
The Microsoft Network Monitor utility version 2.1 that comes with SMS 2003 is yet another tool for the SMS administrator that provides a mechanism for analyzing and monitoring network traffic among computers in your network. It’s similar in function to other more expensive hardware-based tools currently available in the market. It’s used to identify heavily used subnets, routers, and WAN connections, recognize bottlenecks and potential bottlenecks, and develop trends to optimize the network infrastructure and placement of computers and servers, and, in our particular case, SMS site systems.
Network Monitor, by default, captures network traffic that passes through the NIC on the computer running Network Monitor. This means that, by default, Network Monitor captures only network traffic that’s generated on the same network segment as the computer running Network Monitor. If you want to monitor traffic on a different network segment, you can do so by using Network Monitor to capture traffic passing through the NIC of a remote computer on that other network segment. The remote computer must have the Network Monitor driver installed on it. You can install the Network Monitor driver like any other network protocol through the properties dialog box of the local Network Connections Control Panel program on that computer.
Network Monitor 2.1 provides the following functions:
Capture, filter, and display network frames
Edit and forward frames
Monitor traffic for remote computers
Determine which users and protocols used the most bandwidth
Determine location of routers
Resolve device names to Media Access Control (MAC) addresses
This version of Network Monitor also includes “experts.” These aren’t little network gurus that come popping out of the box. They are post-capture analysis tools that can facilitate the administrator's understanding of the data collected. Table 6.3 describes these experts and what they’re designed to accomplish.
|
Expert |
Description |
|---|---|
|
Average Server Response Time |
Identifies the average time each server in the capture took to respond to requests and the number of clients interacting with each during the capture |
|
Property Distribution |
Calculates protocol statistics for a specified protocol and property |
|
Protocol Coalesce Tool |
Combines all the frames of a single transaction that might have been fragmented into a single frame and creates a new capture file using this information |
|
Protocol Distribution |
Calculates which protocols generated the most traffic during the capture session |
|
TCP Retransmit |
Identifies which Transmission Control Protocol (TCP) frames were transmitted more than once during the capture, indicating congestion or connectivity issues |
|
Top Users |
Identifies the senders and recipients of frames that generated the most traffic during the capture session |
In order to run Network Monitor 2.1, you and your computer must meet the following requirements:
You must have local Administrator privileges on the computer running Network Monitor 2.1 or local Administrator privileges on any remote computer that will be monitored using the Network Monitor Driver, or both.
The computer has a NIC that supports promiscuous mode (p-mode). This allows the NIC to receive any and all frames that pass through it on that network segment.
You have already installed Network Monitor 2.1 (run setup from the Netmon\i386 folder on the SMS 2003 CD).
Given that these requirements are met, you can begin using Network Monitor. This tool has its own online help, which can assist you with the more detailed uses of the product and which I highly recommend you use for future reference. However, in this chapter I want to visit some of the more common uses and features. Let's review some fundamentals for using Network Monitor.
The most fundamental purpose for Network Monitor is to capture network traffic for analysis and troubleshooting.
To capture network traffic using Microsoft Network Monitor, complete the following steps:
Start Network Monitor from the Microsoft Network Monitor program group.
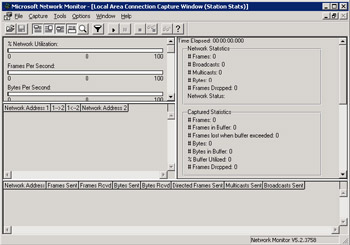
The Network Monitor capture window is displayed as shown in Figure 6.12.
Choose Start from the Capture menu. The captured frames will be evident in each section of the Network Monitor capture window.
When you have captured enough data, choose Stop from the Capture menu to end the capture session. You can then view statistics or save the captured data as a file for viewing individual frames later.
Alternatively, choose Stop and View from the Capture menu to end the capture session and immediately view individual frames that were captured.
Without any further filtering, all frames generated on the network and received by the monitored computer will be captured and potentially saved and displayed. This can add up quickly, as any network administrator can attest. The capture file’s default size is 1 MB. As the file reaches capacity, it drops the oldest data and adds the newest. You can use filters to manage the amount of data that’s collected in the capture file, and you can change the capture file’s default size.
Frequently, you might be interested in the traffic generated between two specific computers—for example, between the Site Server and the server running SQL that’s hosting the SMS database, or between the Site Server and its site systems, or between an SMS client and a client access point (CAP). You can easily accomplish this by adding a filter before initiating a capture session. Filters can be based on protocol(s) used, specific frame property, such as Service Advertising Protocol (SAP) or Etype, or by the originating or destination address. You can also filter based on network segment if you’re capturing remotely.
To establish a capture filter, complete the following steps:
Start the Network Monitor.
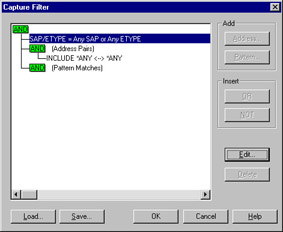
Select Filter from the Capture menu to display the Capture Filter dialog box, as shown in Figure 6.13.
Figure
6.13: Capture Filter dialog box.
Select the property you wish to filter against.
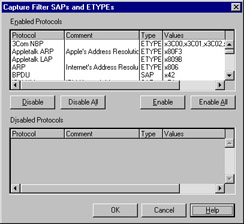
If you choose SAP/ETYPE, you can then click Edit to specify the protocols that will be captured during the capture session, as shown in Figure 6.14. By default, all protocols are enabled.
Figure
6.14: Capture Filter SAPs And ETYPES dialog box.
If you choose Include under Address Pairs, you can click Edit or Address to modify the computers monitored from the default of ANY to a specific set of addresses.
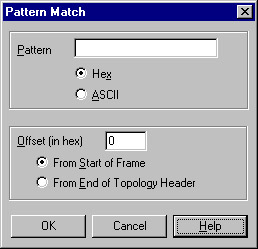
If you choose Pattern Matches, you can click Pattern to specify that only frames that contain a particular pattern of ASCII or hexadecimal data be captured. The pattern can start at the beginning of the frame or at a specified offset. The Pattern Match dialog box is shown in Figure 6.15.
Choose OK. Then start your capture session. Only frames that meet your criteria will be collected during the capture session.
You can also configure Network Monitor to perform an action when the capture file fills to a certain level or when a particular pattern match is detected. The trigger can sound an audible signal, stop capturing data at that point, or execute a command line program or batch file.
To establish a capture trigger, follow these steps:
Start Network Monitor.
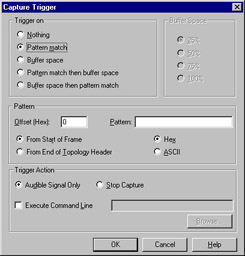
Select Trigger from the Capture menu to display the Capture Trigger dialog box, as shown in Figure 6.16. By default, no triggers are enabled.
Select the type of trigger that you want to enable. Buffer Space refers to the filled size of the capture file and Pattern Match refers to those frames that contain a particular pattern of ASCII or hexadecimal data to be captured. The pattern can start at the beginning of the frame or at a specified offset.
If you choose a buffer trigger, select the desired percent of buffer space.
If you choose a pattern match trigger, enter the hexadecimal or ASCII text pattern that you need to match and an offset value, if necessary.
Select a Trigger Action. These are fairly self-explanatory. One example of a command line action might be a net send command to the SMS Administrator noting that a capture trigger event occurred, that is, net send SMSAdmin1 Capture Trigger Event Occurred.
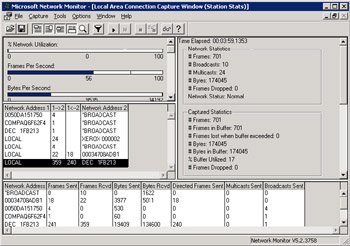
When you stop a capture session, you can view capture statistics in the Capture Window, an example of which is displayed in Figure 6.17. This window is divided into four sections sometimes called “panes.” The top left pane, referred to as the Graph pane, represents five different graphic charts of the frames generated and received during the capture session. This pane is dynamic and only active during the capture session itself. The data monitored is self-explanatory.
The middle left pane, called the Session Statistics pane, displays a summary of the frames sent and received between this computer and any other specified computers. In the example in Figure 6.17, 18 frames were sent from a computer with MAC address 00034708ADB1 to the LOCAL server and 22 frames were sent form the LOCAL server to the other computer.
The bottom pane, called the Station Statistics pane, displays more detailed frame information on a computer-by-computer basis, such as frames sent and received, bytes sent and received, directed frames, broadcast frames, and multicast frames.
Finally, the right pane, referred to as the Total Statistics pane, displays summary information about the capture session as a whole. These are divided into network statistics, captured frames statistics, per second statistics, network card statistics, and network card error statistics (frames dropped, CRC errors).
You might have noticed from Figure 6.17 that Network Monitor identifies source and target computers largely by their MAC address. This is the network card address, of course. You can make this screen, as well as the frames view, friendlier to read by helping Network Monitor to resolve the MAC address to a NetBIOS name. You can accomplish this by completing the following steps:
Choose Addresses from the Capture menu.
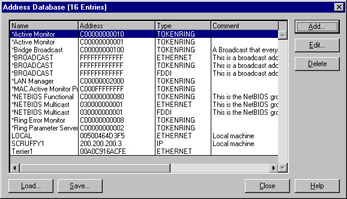
In the Address Database dialog box, as shown in Figure 6.18, click Add to display the Address Information dialog box, as shown in Figure 6.19.
Figure
6.18: Address Database dialog box.
Enter the NetBIOS name, or whatever friendly name you would like, in the Name text box. Enter the MAC address in the Address text box, and select a network type from the Type drop-down list if necessary.
Click OK.
You can then close the Address Database screen to use the name values for this session or save them to facilitate viewing of future captures.
However, although this statistical information can certainly help identify the amount of traffic generated, there are still the frames themselves to view. By viewing the frames that were captured, you can understand the type of traffic that was generated and which frames are associated with certain kinds of activity on various servers. For example, when did the CAP forward discovery data to the Site Server, and how much traffic was generated as a result?
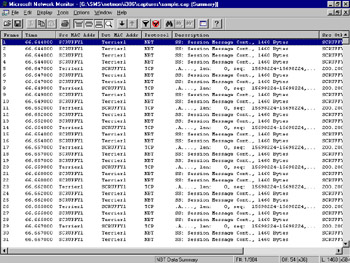
You can view frames by opening a saved capture file or by choosing Stop and View when ending a capture session. Figure 6.20 shows a sample capture file of individual frames. In this view you can see the frames generated and received between the two servers Scruffy1 (the LOCAL server) and Terrier1.
This screen begins with a frame number, a time offset, the source and destination MAC addresses (which could be resolved to names as they are here), the protocol type of the frame, a brief description of the frame, and the MAC address resolved to a NetBIOS name or IP address.
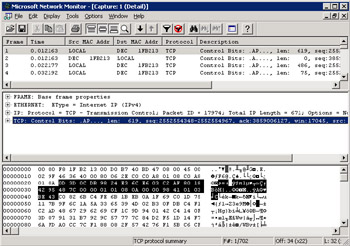
Each frame is “viewable” in that if you double-click a frame, you can view the frame’s contents. Figure 6.21 shows one individual frame’s contents. At the top is the Summary pane, a tiled view of the capture file where we started.
The middle pane is the Detail pane, showing us an expandable view of the contents of the frame, including its size, Ethernet information such as MAC address, IP information, such as IP address, and SMB information, such as the frame offset and flags if the frame is part of a fragmented group of frames, and the frame data. The bottom pane is the Hexadecimal pane, displaying the frame contents both in hex and in text where possible.
The Network Monitor Experts included with Network Monitor 2.1 are post- capture analysis tools designed to help facilitate the understanding of the data collected. The experts were outlined previously in Table 6.3.
You can enable the experts by following these steps:
Open a capture file.
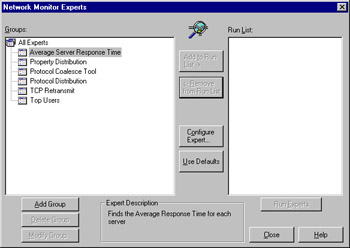
Select Experts from the Tools menu. The Network Monitor Experts dialog box is displayed, as shown in Figure 6.22.
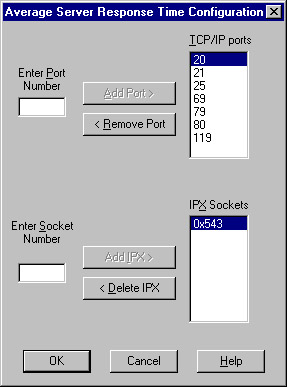
Click the expert you would like to enable, such as Average Server Response Time, and choose Configure Expert, as shown in Figure 6.23. In this case you can add or delete Transmission Control Protocol/ Internet Protocol (TCP/IP) port numbers and IPX socket numbers. Other experts will offer other configuration choices.
Figure
6.23: Configure Expert dialog box.
Click Add To Run List.
When you’re ready to run the expert, choose Run Experts.
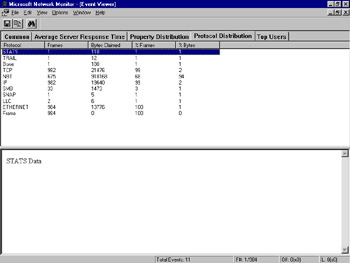
When the expert has completed processing, an event screen is displayed similar to Figure 6.24 showing the information you requested. In this example all experts were selected to run. You can access the result of each by selecting its respective tab in the viewer.
|
|
< Day Day Up > |
|