


The Pivot Gridcontrol represents data from an underlying data source in a cross-tabulated form to create cross-tab reports. It calculates summaries and summary totals against specific fields, and displays the summary values within data cells.
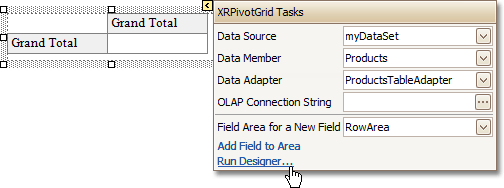
There is a designer allowing you to easily customize the Pivot Grid. It can be invoked using the control's Smart Tag.
The Pivot Grid displays data in a manner similar to Pivot Tables in Microsoft Excel. Column headers display unique values from one data field, say, car models. Row headers display unique values from another field, say, dates. Each cell displays a summary for the corresponding row and column values. By specifying different data fields, you can see the total number of cars sold on a particular date, or the total number of deals, etc. This way, you get a really compact layout for data analysis.
A tutorial on how to use the Pivot Grid control can be found at Cross-Tab Report.
In the Property Grid, the Pivot Grid control's properties are divided into the following groups.
 Note
Note