Workspace Reports: learning about the Central/Remote Workspace Reports
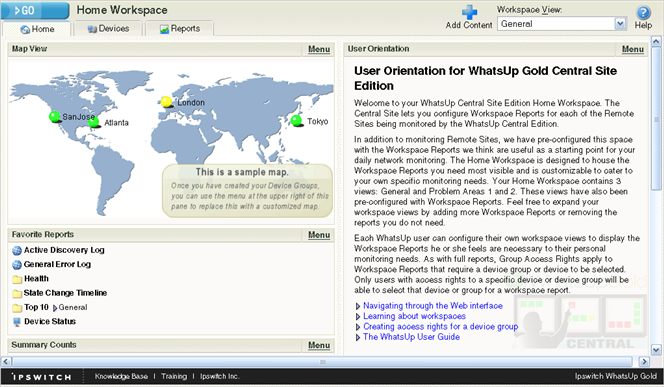
The WhatsUp Home workspace is the first screen you see after logging in to the WhatsUp Gold web interface. This is your personal, customizable Home portal, or workspace.

The WhatsUp Gold Remote/Central workspace reports are similar to the workspace reports you may have used in other versions of WhatsUp Gold. The primary difference is the Remote/Central workspace reports let you set up workspace reports that watch Remote Site network status from your WhatsUp Gold Central Site. For more information, see Learning about workspace reports in the Help.
Workspaces are designed to be user-specific, and are configurable to include workspace reports specific to users' needs. Workspaces contain multiple views that let you organize various workspace reports by the type of information they display. When you begin customizing your workspace views, you should consider the types of information you need to view most often, the remote sites and devices in which you need to pay closest attention, and what level of detail you want to monitor through a particular workspace view.
There are several Central/Remote workspace reports included in a Remote Sites workspace view for the WhatsUp Gold distributed monitoring solution. They are available if you have completed a new installation of WhatsUp Gold distributed monitoring solution. If you are upgrading from a previous version of WhatsUp Gold, the Remote Sites reports are not added to the workspace view for existing users; however, you can create a new Workspace View and add the default Central/Remote workspace reports to it.
Following are the default Central/Remote workspace reports included in the Remote Sites workspace view:
|
Remote/Central Reports |
Description |
|
Remote Site List |
Lists all configured Remote Sites. The report contains: Display Name Local device Last connect time Last refresh time |
|
Device Status (Remote) |
Provides a status summary of all monitored devices on a selected Remote Site. The report contains: Display name Devices up Devices down In maintenance Last refresh time |
|
Monitor Status (Remote) |
Provides a status summary of all monitors configured for the monitored devices on a Remote Site. The report contains: Display name Monitors up Monitors down Last refresh time |
|
Remote Site Overview |
Displays an information overview for a selected Remote Site. The report contains: Http address Last connect time Last refresh time # of devices # of monitors # of queries Display name Device type Host name Address |
|
Summary Counts (Remote) |
Provides a summary for a Remote Site by the total number of: Monitored devices Up devices Down devices Devices with down Active Monitors Devices in Maintenance Active Monitors Down Active Monitors Up interfaces Down interfaces Actions fired in the last 4 hours |
|
Tail of Action Activity Log (Remote) |
Provides the tail (last 10 records) of the Action Log for a device group on a Remote Site. The report contains: Date Source Action Name Trigger |
|
Tail of Remote Site Log |
Provides the tail (last 10 records) of the Remote Site Log. The report contains: Date Type Message Remote Site |
|
Active Monitor Status (Remote) |
Lists all Active Monitors assigned to devices on the selected Remote Site |
|
Threshold - Ping by Response Time Over 1 ms (Remote) |
Displays ping response times by threshold for devices in a specific device group on a Remote Site. The report contains: Remote Site Last snapshot Device Interface Max (ms) Avg (ms) |