Navigating through the web interface
The WhatsUp Gold web interface contains a lot of information - due to the extremely large number of items that can be viewed or configured, the web interface is divided into logical categories:
- GO Menu
- Home
- Devices
- Reports
The GO Menu
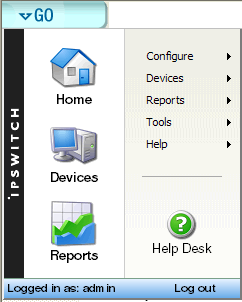
The main menu for the web interface is housed within the GO button, located in the upper-left corner of your browser. The Go menu is similar to the Microsoft Windows Start menu. The GO menu allows navigation to other areas of the web interface with only a few clicks. It is always present in the top-left corner of the browser window, with the exception of when you are viewing dialogs. All of the global configuration items, such as Credentials and Action Policies, can be launched from any Workspace or full report from the GO menu.

With the GO menu, you can navigate to the areas you will use most in WhatsUp Gold, including your customized Home workspace views; your monitored devices list; Network Tools; the configuration of the Passive, Active, and Performance Monitor libraries; and the WhatsUp Gold Help.
The Home Workspace
The WhatsUp Gold Home Workspace is the first screen you see after logging in to the web interface. This is your personal, customizable Home Workspace. The purpose of the Home Workspace is to display important information about the health of monitored servers and network devices in a way that can be tailored to the specific needs of individuals.
For more information on your Home Workspace, see Customizing Workspace Views.
The Workspace Toolbar
- Add Content. Use this button to add workspace reports to your workspace views.
- Workspace View. Use this drop-down menu to edit your workspace views and to switch between workspace views.
- Help.
Use this button to view the WhatsUp Gold Help for the window you
are currently viewing.

The Devices tab
The WhatsUp Gold Devices tab is where your monitored devices are displayed and managed. The Devices tab has two modes: Device View and Map View. You can add devices in either mode by using the Devices Toolbar located in the upper-right corner of your browser.
The Devices Menu bar
- File. Use this section of the menu to add new devices, device groups, and dynamic groups.
- Edit. Use this section of the menu to copy, move, edit, and delete devices and device groups. You can also access Device Status and Device Properties from this section.
- View.
Use this section to switch between Device and Map views, to
navigate to device groups, and to refresh the screen.

The Devices Toolbar
- New Device. Use this button to add a new device to your list of monitored devices.
- New Group. Use this button to add a new device group to your list of monitored devices.
- New Dynamic
Group. Use this button to add a new dynamic group to your
list of monitored devices.

The Right-Mouse Menu
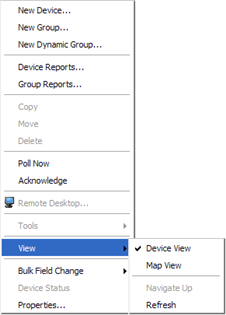
A similar right-mouse menu available in the WhatsUp Gold console is available on the web interface on the Devices tab. The right-mouse menu displays when you right click in the Devices tab after selecting a device or set of devices.

The Reports tab
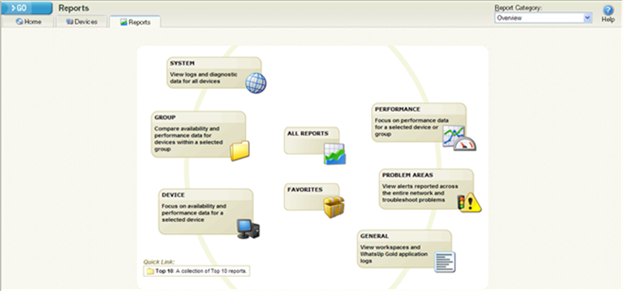
The Reports tab is the starting point for launching Full Reports within the WhatsUp system. Selecting the Reports tab will display the Reports Overview screen that divides the reports into several categories.

Report Category menu
The Report Category drop-down menu allows you to jump to report category screens from where to choose reports for viewing.