Custom Peformance Monitors
Performance Monitors gather specific types of data on the devices they are assigned to. System wide monitors are configured using the Performance Monitor Library, but you can also create specific SNMP and WMI monitors to be used on a per-device basis.
To create custom performance monitors for system-wide use:
- On the WhatsUp Gold web interface, go to Go > Performance Monitor Library.
- In the Performance Monitor Library, click New.
- Select the monitor type: SNMP or WMI.
- Configure the monitor as follows for the type of monitor you are creating:
For WMI:
- On the Add Performance Counter dialog, enter a name and description for the monitor.
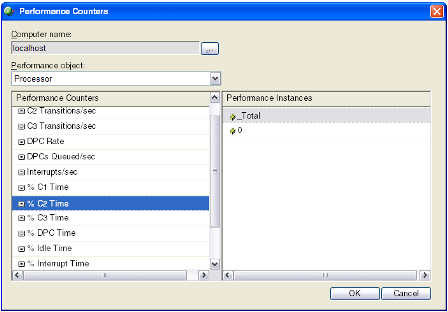
- Click the Browse (...) button next to the Instance box to go to the Select Performance Counter dialog.
- Click the Browse (...) button next to Select counters from computer box. The Select Computer dialog appears.
- Enter the share name or IP address of the computer you want to connect to.
- Enter the domain and user login for the account on this computer. If a domain account is used, then the expected user name is domain\user. If the device is on a workgroup, there are two possible user names: workgroup name\user or machine name\user.
- Enter the password for the login used above
and click OK to connect to
the
computer. - Use the Performance counter tree to navigate
to the performance counter you want to monitor.

- After you select the performance counter, select the specific instance you want to monitor.
- Click OK to add the counter and instance to the
Add Performance Counter
dialog. - Verify the configuration and click OK to add the monitor to the library.
For SNMP:
- On the Add SNMP Performance counter dialog, enter a name and description for the monitor.
- Click the Browse (...) button next to the Instance box to go to the Select Performance Counter dialog. You must enter a numerical value in the Instance field.
- Enter the share name or IP address of the computer you want to connect to.
- Enter the SNMP credential used to connect to the device (or click the Browse (...) button to access the Credentials Library to create a new credential.)
- If needed, adjust the Timeout and Retries count for the connection to the device.
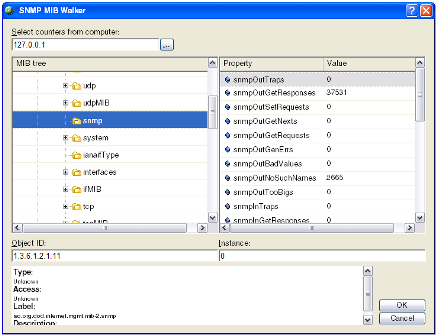
- Click OK. The SNMP MIB Walker appears.

- Use the navigation tree in the left panel to select the specific MIB you want to monitor.
- In the right pane, select the Property of that MIB you want to monitor. You can view more information about the property/value pair at the bottom of the dialog.
- Click OK to add the OID to the Performance counter and Instance box in the Add SNMP Performance counter dialog.
- Verify the configuration and click OK to add the monitor to the library.
- After the monitor has been added to the library, you can enable the monitor through Device Properties > Performance Monitors.
- On the WhatsUp Gold web interface, select a device and right-click. Select Properties from the right-menu.
- On the Device Properties dialog, select Performance Monitors.
- Click New next to the Individual performance monitors list.
- Select the monitor type: SNMP or WMI.
- Follow the directions above for creating either an SNMP or WMI monitor.
- You can suspend or enable data collection on that monitor by selecting or clearing the checkbox next to the monitor name.
- On the WhatsUp Gold web interface, select a device and right-click. Select Properties from the right-menu.
- On the Device Properties dialog, select Performance Monitors.
- Click New next to the Individual performance monitors list.
- Select the monitor type: SNMP or WMI.
- Follow the directions above for creating either an SNMP or WMI monitor.
You can suspend or enable data collection on that monitor by selecting or clearing the checkbox next to the monitor name.
Ipswitch uses a BitSight2 temperature sensor from Ravica to monitor the temperature and humidity in our testing labs. Since the device is SNMP enabled, we added a device for the sensor to our 'Office' group and enabled SNMP on that device.
With the device in the group, we created a Custom SNMP Performance Monitor for that device.
Since the OID for temperature and humidity monitoring is included with the documentation for the device, we did not have to add the MIB to the MIB directory. Instead, we simply entered the OID into the Add SNMP Performance Counter dialog.
When the performance monitor is running, data is collected by the application and displayed on the Custom Performance Monitor report. Once you have several hours of data, you might have graph that looks like this: