About types of workspaces
The WhatsUp web interface has three types of workspaces:
- Home
- Device Status
- Top 10
Each of the workspaces supports multiple user-defined views and up to 15 small reports known as Workspace Reports can be displayed within each View. These Workspace Reports show content ranging from Current Interface and CPU utilization to Syslog messages. It's up to you to decide which content is most important.
Home Workspace
The WhatsUp Gold Home Workspace is the first screen that you see after you log in to the web interface. Referred to as "Home," this universal workspace is designed to house the network information that you need most visible.
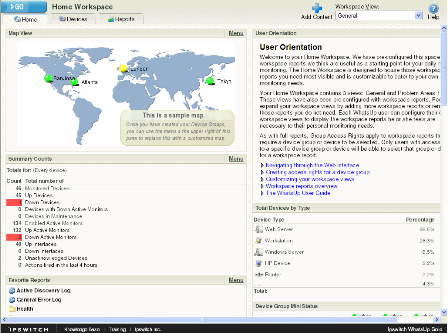
The Home Workspace can display both Home- and Device-level workspace reports. You can place any workspace report on a Home workspace; mixing and matching summary, group, and device-specific data.
The content of this Workspace varies for each user. Changes that you make to a workspace view only affect your user account. This Workspace should contain the information about your network that is most important to you. This Workspace comes with some stock content such as Devices with Down Active Monitors and Top 10 Devices by Ping Response Time, although these reports can and should be replaced by the reports that are most relevant to your job.
The Home Workspace also includes three starter views:
- General
- Problem Areas 1
- Problem Areas 2
Each workspace view includes several default workspace reports that you can decide to keep, alter, or remove. You can also add other workspace reports to these views. For more information, see Adding workspace reports to your Home Workspace.
You can create your own workspace views for the Home workspace through the Manage Workspace Views dialog.
Device Status workspaces
The Device Status Workspace is very similar to the Home Workspace, but the Device Status workspace is limited to display only Device-level workspace reports. Only workspace reports specific to a single device can be placed on a device workspace.
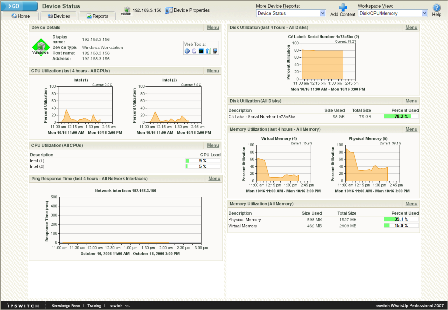
The Device Status Workspace is designed to
present relevant information about the health and performance of a
single monitored device. Throughout the
Web interface you will see links to devices, such as ![]() . All of these
links point to the Device Status Workspace for the particular
device. If there is a potential problem with a monitored device,
the Device Status is a good place to look for more information on
the device status. The Device Status Workspace includes several
stock workspace views:
. All of these
links point to the Device Status Workspace for the particular
device. If there is a potential problem with a monitored device,
the Device Status is a good place to look for more information on
the device status. The Device Status Workspace includes several
stock workspace views:
- Disk/CPU/Memory
- General
- Problem Areas
- Router/Switch/Interface
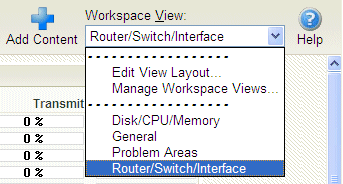
There are many different types of devices with a variety of features and services that can be monitored. The Workspace Views let you select a view that is most appropriate for the individual device. Each time the report is visited, it displays the last view that was selected for a device.
The Disk/CPU/Memory View is most appropriate for a Windows or UNIX host that supports the Host Resources MIB for performance monitoring. The Router/Switch/Interface View is most appropriate for a manageable Switch or Router that is capable of reporting Interface or Bandwidth utilization.
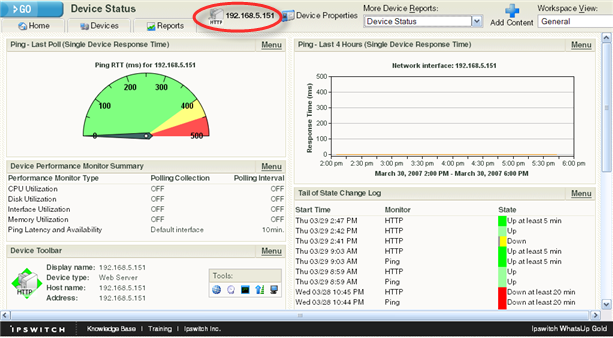
The device name and icon displays at the top of the Device Status report. You can click the device name, for example 192.168.5.151, to change the focus of the report to another device without leaving the report.
For more information, see Adding workspace reports to a Device Status workspace.
The Top 10 workspace
The WhatsUp Gold Top 10 workspace displays the Top 10 full reports for your network devices. The role of the Top 10 Workspace is to show devices, at a glance, that may be potential problems and to provide information on the current health of your network devices. It is pre-configured to include workspace reports that display data on the top network devices by:
- Ping Response Time
- Ping Packet Loss
- CPU Utilization
- Memory utilization
- Disk Utilization
- Disk Free Space
- Interface Utilization
- Interface traffic
- Custom Performance Monitor
- Ping Availability
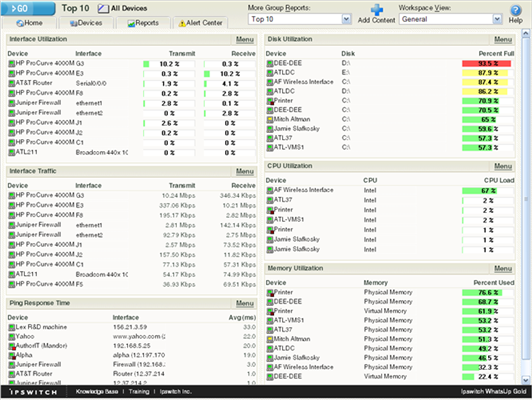
Unlike the Home and Device Status workspaces, the Top 10 workspace is designed with only the General workspace view. You can customize the general view in the same way you can other workspace views by removing the default workspace reports and/or adding other Top 10 and Threshold workspace reports. For more information, see Adding workspace reports to your Home Workspace.
The Top 10 Workspace also displays threshold reports. These reports let you set a threshold to filter out items that do not match a specified criteria. For example, the Interface Utilization Threshold report could have been used (in the example above) instead of the Interface Top 10 report, to filter out the interfaces that are not above 50% utilization. Using this approach, only interfaces with significant usage would be shown.