One of the most common log reports is a "TOP 10" list showing
the top entries appearing in a ranking.
This is usually achieved with a query that calculates some
aggregate function within groups, orders the groups by the value of
the aggregate function, and then uses the TOP keyword in the
SELECT clause to return only a few
records at the top of the ordered output.
As an example, the following query returns the TOP 10 URL's
requested from an IIS log file:
SELECT  TOP 10  cs-uri-stem AS Url,
				COUNT(*) AS Hits
FROM <1>
GROUP BY Url
ORDER BY Hits DESC
Url							Hits
------------------------------ -----
/police/laws.nsf			 25183
/cgi-bin/counts.exe			5694
/police/rulesinfo.nsf		5202
/police/laws.nsf			 3980
/images/address.gif			3609
/image/1_m.jpg				 3540
/npanews0.htm				3305
/images/tibg.gif			 2955
/startopen/startopen920707.htm 2502
/police/find.nsf			 2465
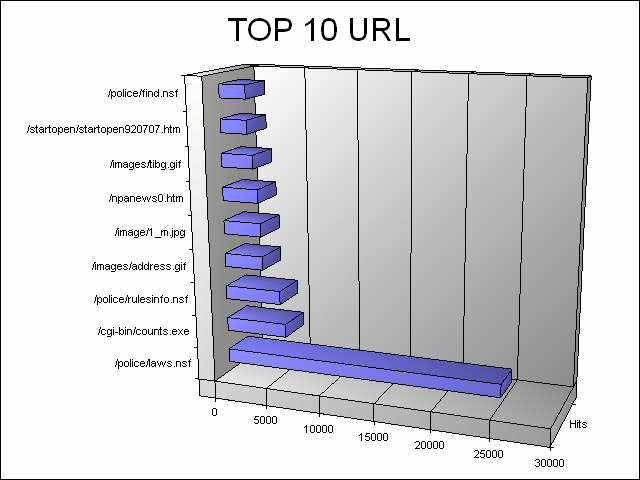
This kind of reports is a perfect candidate for the CHART Output Format; assuming that the following
query is saved in the "querytop.sql" text file, the following
command will generate an image file containing a chart of the query
output above:
SELECT  TOP 10  cs-uri-stem AS Url,
				COUNT(*) AS Hits
INTO Urls.gif
FROM <1>
GROUP BY Url
ORDER BY Hits DESC
C:\>LogParser file:querytop.sql -o:chart -chartType:Bar3d -chartTitle:"TOP 10 URL"

© 2004 Microsoft Corporation. All rights reserved.