|
|
Replication Status Viewer |
| Replication Status Viewer | ||||||||||||||
|
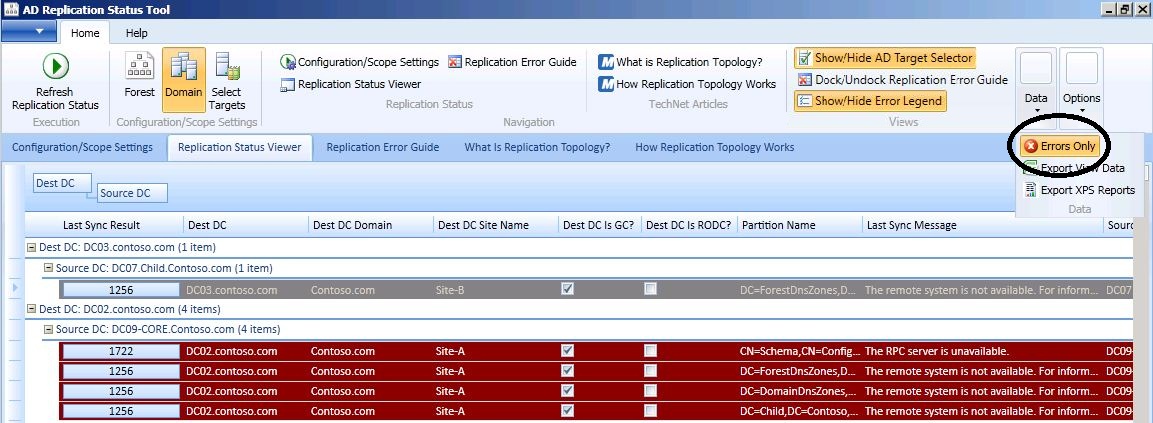
After Replication Status data has been collected the screen is automatically switched to the Replication Status Viewer unless a failure occured during discovery. |
||||||||||||||
|
|
||||||||||||||
|
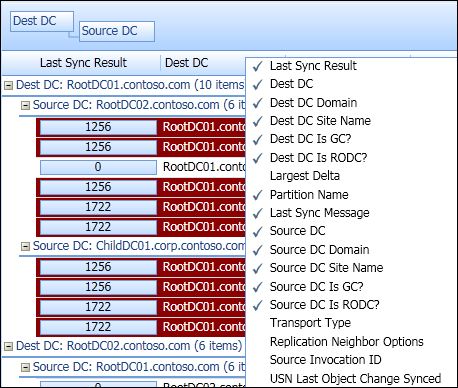
The Grid view is automatically expanded to group by all Destination DCs, and then by Source DCs.
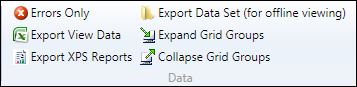
The expanded grid groups can be collapsed. Click Collapse Grid Groups to collapse one level of groups, the last column grouped by will collapse.
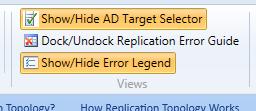
Error Legend status
bar
The Error Legend status bar contains six color codes.
Depending on when replication
was last successful for a partition, a row color can be blank or
any of the above colors.
|
||||||||||||||
|
Hide/unhide
columns
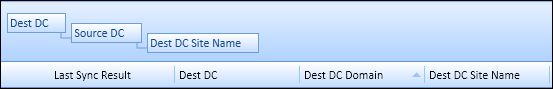
Sort and Grouping
view You can also change the
grouping view. By default the view is grouped by Destination
DC and then within each Destination DC it is grouped by Source
DC.
To remove a column from the grouping view, drag the column header back to the column headers and release it when a black X is displayed. The sort function can be used in conjunction with the grouping view. For example, to see most current to least current replication failures grouped by replication error, create a grouping for "Last Sync Result" and sort the "last Successful Sync" column in oldest to newest order.
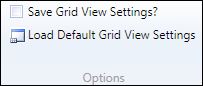
To save any change to the default
grid view, such as adding and removing columns or changing the
grouped view, click Save Grid View Settings?
in the Options group on
the Home tab. The next time the AD
Replication Status Tool is started the saved Grid View will be the
default Grid View. Columns
Some columns are not visible by
default but can be made visible in the grid by right clicking on
any column header and then click the unchecked column. It is
also possible to hide default columns from the grid by clicking the
checked column.
|
||||||||||||||
| View Errors Only | ||||||||||||||
|
||||||||||||||
|
|
||||||||||||||
|
To only view errors in the
Replication Status Viewer screen click Errors
Only in the Data group on the
Home tab. The view will then be adjusted to
only display rows with errors. |
||||||||||||||
|
Depending on the screen resolution the tool might not be able to fully display all command groups and you might see groups collapsed as in the above image for the Data and Options groups. Click the down arrow on the collapsed group name to display all command in that group. |
||||||||||||||